How to Benchmark Sustainability Performance Using Financial Data
Dec 22, 2025
Use audited financial transactions to map Scope 1–3 emissions, calculate emissions intensity, benchmark peers and generate audit-ready sustainability reports.
Using financial data for sustainability benchmarking helps organisations measure their performance against industry standards and peers. By linking financial transactions to emissions categories, accountants can calculate precise metrics like Scope 1–3 emissions and emissions intensity. This approach not only ensures accuracy but also aligns environmental goals with business outcomes.
Key Points:
Why Financial Data? It's already audited, structured, and reliable for emissions calculations.
Metrics to Measure: Scope 1 (direct emissions), Scope 2 (indirect emissions from energy), Scope 3 (value chain emissions), and emissions intensity (e.g., tonnes CO2e per £ revenue).
Automation Tools: Platforms like neoeco simplify mapping financial data to emissions categories, eliminating manual errors.
Benchmarks: Use SECR disclosures, MD&A sections, or other frameworks like GHGP and ISO 14064 for comparison.
Dashboards: Real-time tools track progress against targets and provide actionable insights.
Accountants in the UK are uniquely positioned to lead these efforts, bridging the gap between ESG goals and financial performance. By integrating sustainability data into financial reporting, firms can help clients reduce emissions, meet regulatory requirements, and improve decision-making.
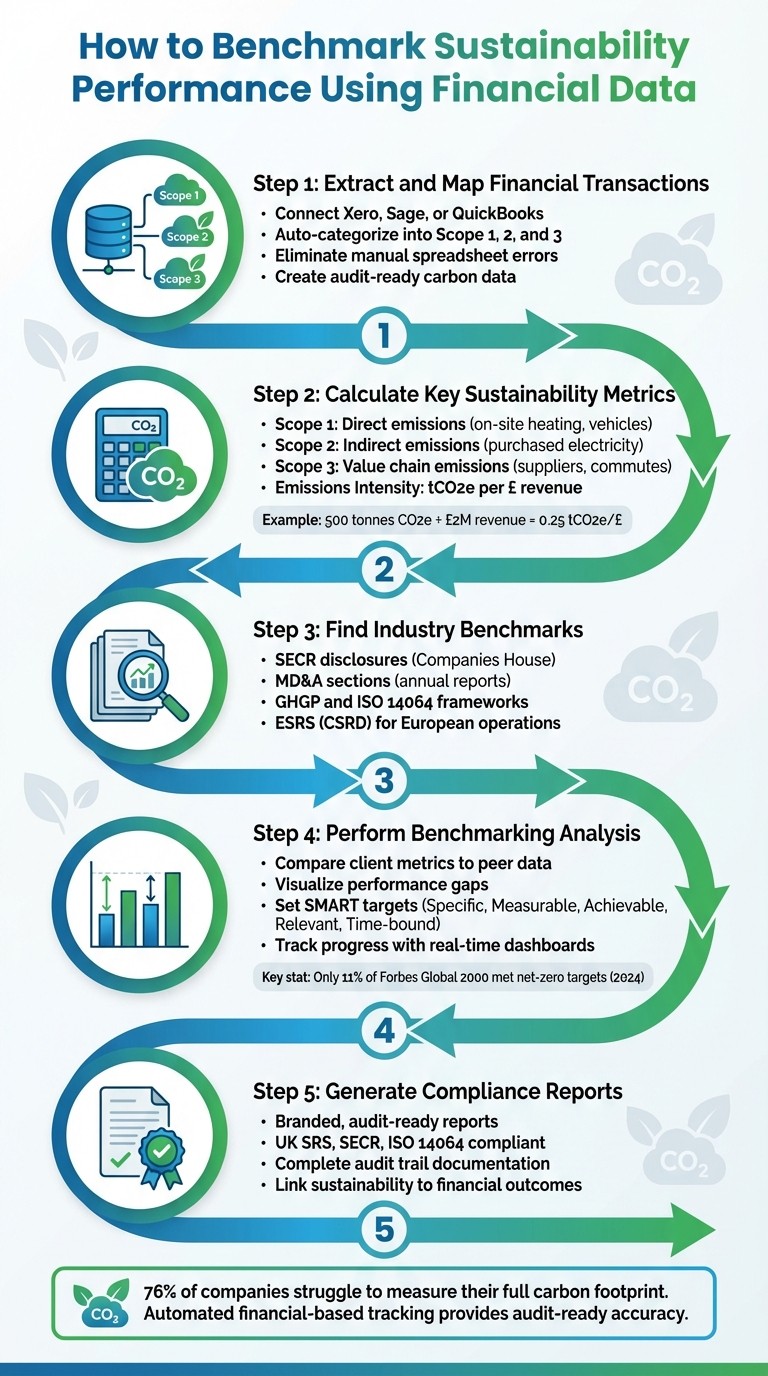
5-Step Process for Benchmarking Sustainability Using Financial Data
Step 1: Extract and Map Financial Transactions to Emissions Categories
Linking Financial Systems with Sustainability Goals
Your financial systems already hold the key to tracking sustainability metrics. Tools like Xero, Sage, and QuickBooks document all client transactions - everything from energy bills and fuel purchases to supplier payments and travel expenses. Each of these transactions carries a carbon footprint that can be quantified and categorised.
Manually extracting and mapping this data is both laborious and prone to errors. Spreadsheets often lead to calculation mistakes, version control headaches, and incomplete audit trails. To ensure accurate and reliable benchmarking, it’s crucial to directly integrate your financial ledger with established emissions frameworks like GHGP, ISO 14064, and SECR. Automating this process is not just a time-saver - it lays the groundwork for precise sustainability mapping.
Automating Transaction Mapping with neoeco
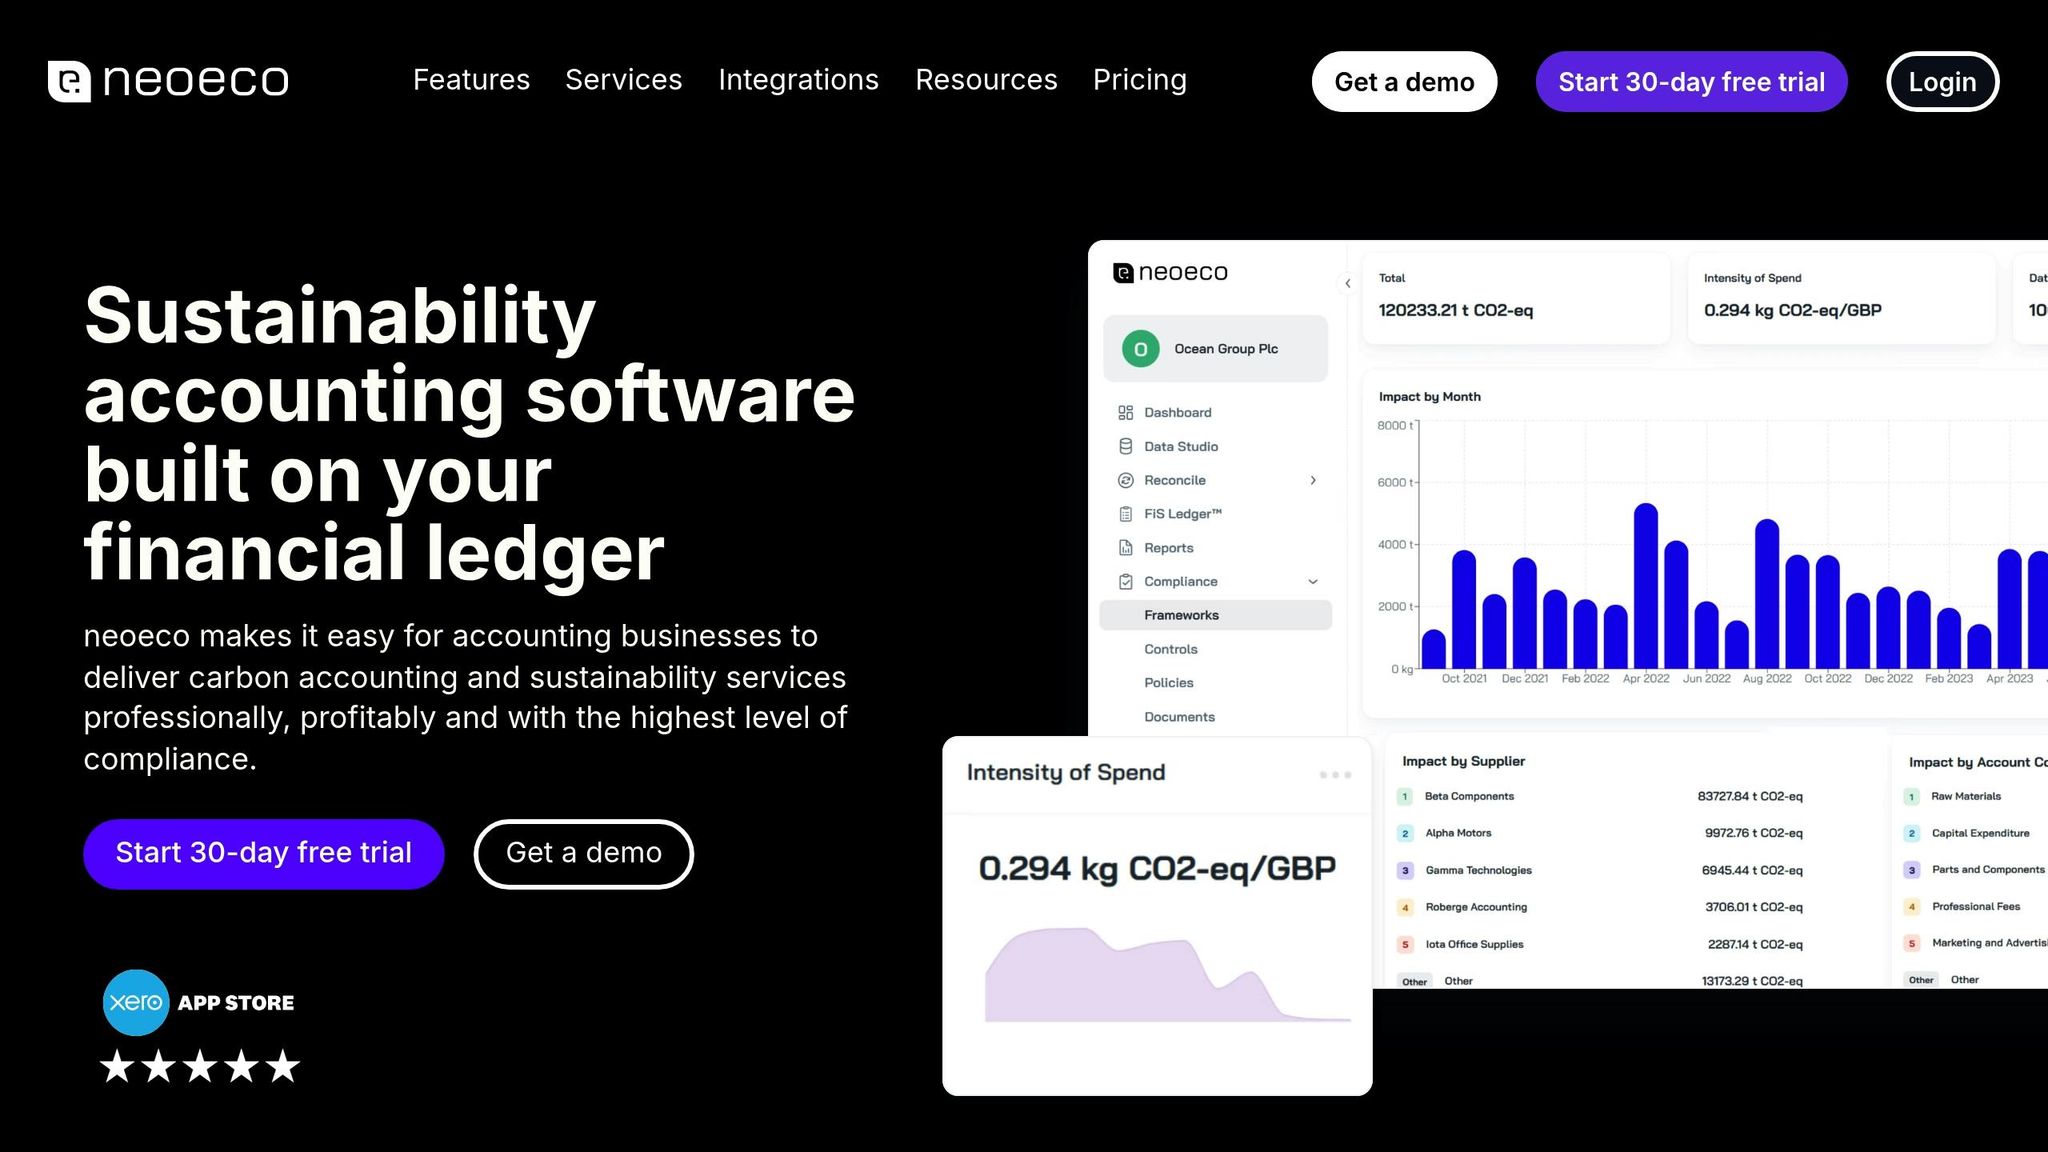
Automation steps in to solve the challenges of manual mapping. neoeco streamlines the process by directly accessing your clients’ financial data. When connected to platforms like Xero, Sage, or QuickBooks, it automatically categorises transactions into Scope 1 (direct emissions), Scope 2 (purchased energy), and Scope 3 (value chain emissions) following GHGP and ISO 14064 guidelines. This eliminates the need for spreadsheets and manual calculations, providing audit-ready carbon data that’s accurate and reliable.
Here’s how it works: imagine a client pays an electricity bill. neoeco identifies the transaction, calculates the emissions factor, and assigns it to Scope 2. Similarly, if raw materials are purchased from a supplier, the system logs it under Scope 3 emissions. This ensures that every pound spent is linked to a carbon output, offering a detailed and traceable record that complies with SECR and aligns with the UK’s emerging SRS standards. For a deeper dive into this approach, explore our FiSM manifesto.
This automated process delivers a fully verifiable carbon footprint, built directly from the financial records you already rely on. It’s ready to benchmark against industry standards in a matter of minutes, not months.
Step 2: Calculate Key Sustainability Metrics from Financial Data
Core Sustainability Metrics to Track
Start by calculating the key metrics: Scope 1, 2, and 3 emissions, along with emissions intensity. Here's a quick breakdown:
Scope 1: Direct emissions, like those from on-site heating or company-owned vehicles.
Scope 2: Indirect emissions from purchased electricity.
Scope 3: Emissions across the value chain, including supplier activities and employee commutes.
Emissions intensity, expressed as tonnes of CO2 equivalent (tCO2e) per £ of revenue, is particularly useful for comparing companies of different sizes. For instance, a business emitting 500 tonnes of CO2e with £2 million in revenue has an intensity of 0.25 tCO2e/£. Compare this to a competitor producing 1,000 tonnes with £5 million in revenue, whose intensity is lower at 0.20 tCO2e/£. Tracking these figures year-on-year helps distinguish genuine emissions reductions from growth-driven changes.
To dig deeper, use two approaches:
Physical carbon accounting: Measures the actual volume of emissions.
Financial carbon accounting: Assigns a monetary value to emissions.
Both methods provide essential insights and form the basis for dynamic dashboards that bring sustainability data to life.
Tools for Real-Time Sustainability Dashboards
Once you've calculated the metrics, real-time analytics can take your reporting to the next level. Relying on manual processes often results in delays, but real-time dashboards turn sustainability data into actionable intelligence that’s ready when you need it. Tools like neoeco create live dashboards that display emissions intensity, Scope 1-3 breakdowns, and progress toward targets - all directly linked to the ledger. This eliminates the need to wait until year-end and closes data gaps.
These dashboards enable CFOs to track sustainability performance with the same precision they apply to financial KPIs. As CPA Australia points out:
"CFOs can help to ensure an organisation's commitment to ESG is translated into meaningful outcomes... by influencing resource allocation, such as investments in eco-friendly tech, energy efficiency measures, waste reduction programs and projects with social impact".
When sustainability metrics are integrated with financial data, resource allocation becomes both clearer and easier to justify. To help CFOs take on a leadership role in sustainability, explore how ISSB reporting can align with a strategy that ties ESG goals to financial performance.
Real-time dashboards also open the door to proactive client advisory. Instead of delivering an annual report that looks backward, you can highlight trends as they emerge, uncover cost-saving opportunities, and show the financial benefits of sustainability initiatives in real time. This shifts the focus from simple compliance to strategic decision-making, positioning your firm as an essential partner for your clients.
Step 3: Find and Use Industry Benchmarks
Where to Find Industry Benchmarks
Locating reliable benchmarks for your client's sustainability metrics is essential. For accountants in the UK, SECR disclosures are a convenient starting point. These filings, available in the strategic reports of annual accounts at Companies House, provide a wealth of peer data for large UK companies.
In addition to SECR, the Management Discussion and Analysis (MD&A) sections of annual reports are invaluable. They offer insights into how other businesses link sustainability performance with financial results. Larry Bradley, Global Head of Audit at KPMG, highlights this connection:
"There will be true connectivity when investors can recognise the same business model and strategy through all three windows [financial statements, sustainability disclosures, and MD&A]".
This perspective underscores the importance of understanding how peers integrate sustainability into their broader business strategies.
If you're working with public-sector clients, resources like the Sustainability Reporting Guidance 2024-25 and the Government Financial Reporting Manual (FReM) provide standardised metrics, simplifying cross-sector comparisons. For clients operating across Europe, ESRS (CSRD) disclosures offer additional benchmarking data. However, for UK-focused firms, SECR remains the primary reference point.
These benchmarks go beyond just numbers - they offer context and insights that help you compare your client’s performance against peers effectively. By using this data, you can build a more comprehensive benchmarking analysis grounded in both financial and sustainability metrics.
Comparing Financial-Derived Metrics to Peer Data
Once you've identified the benchmarks, the next step is to compare your client’s financial-derived metrics with traditional activity-based data. This ensures consistency in methodology and reveals how your client stacks up against industry standards.
Financial-derived metrics, such as spend-based Scope 3 calculations, differ significantly from activity-based benchmarks. Spend-based approaches calculate emissions by multiplying total spend by average emission factors (e.g., from EEWIOD). While quick and automated through accounting software, they lack the level of detail provided by activity-based methods.
Feature | Spend-Based Metrics (Financial-Derived) | Activity-Based Metrics (Traditional) |
|---|---|---|
Accuracy | Lower; acts as a proxy or starting point | Higher; reflects actual physical consumption |
Ease of Use | High; automated and requires no manual data collection | Lower; involves manual data gathering from various sites |
Best Use Case | Scope 3 supply chain emissions where data is limited | Scope 1 and 2 direct emissions |
When conducting benchmarking, it's crucial to account for these methodological differences. For instance, if your client uses spend-based metrics while a peer relies on activity-based data, the comparison won't be directly equivalent. However, spend-based methods are particularly useful for Scope 3 emissions, especially for SMEs that often lack detailed supplier data.
The key is consistency. Stick to a stable methodology year after year and compare like-for-like metrics. This approach ensures transparency, builds trust, and strengthens the credibility of your benchmarking analysis.
With these distinctions in mind, you can move forward to analyse the results and pinpoint areas for improvement.
Step 4: Perform Benchmarking Analysis and Identify Gaps
Displaying Benchmarking Results
Once you've calculated the metrics and compared them to industry benchmarks, it's time to analyse performance gaps. The key here is to visualise the difference between your client's performance and the benchmarks. Dashboards are a great way to simplify complex data, turning it into insights that are easy for clients to grasp.
Using charts and trend lines is particularly effective for showing year-on-year emissions performance. For example, plotting Scope 1, 2, and 3 emissions against reduction targets gives clients a clear view of whether they're meeting their goals or falling short.
Modern dashboards now offer continuous updates. This real-time approach means you can identify gaps early and tweak strategies well before year-end. Tools like neoeco integrate directly with accounting software such as Xero, Sage, or QuickBooks. They automatically map transactions to emissions categories, highlighting where performance deviates from benchmarks.
When presenting the results, it's important to show both the successes and the areas that need improvement. For instance, if a client's Scope 3 emissions are significantly higher than the industry average, explain the reasons behind this and offer actionable solutions. This level of transparency not only builds trust but also establishes your firm as a reliable advisor. Highlighting these gaps is critical, especially since 76% of companies still struggle to measure their full carbon footprint.
Once you've laid out the visual insights, use them to set measurable targets and track progress. This approach underscores the connection between financial data and sustainability strategies.
Tracking Progress Against Targets
Setting goals is just the beginning; keeping track of progress is where the real work happens. To ensure targets are effective, they need to follow the SMART framework: Specific, Measurable, Achievable, Relevant, and Time-bound. Vague objectives like "reduce emissions" won't cut it. Instead, aim for precise goals, such as "reduce Scope 1 emissions by 15% by December 2026."
Collaboration plays a huge role here. As CPA Australia points out:
"CFOs can help to ensure an organisation's commitment to ESG is translated into meaningful outcomes... by influencing resource allocation, such as investments in eco-friendly tech, energy efficiency measures, waste reduction programs and projects with social impact".
Your job as an accountant is to ensure that financial data supports these efforts. This means providing accurate, audit-ready tracking of progress. With tools like neoeco, you can maintain a live checklist showing completed tasks, pending items, and areas ready for review. Reliable and traceable financial data is essential for ensuring compliance with frameworks like ISSB reporting or ISO 14064.
The urgency is clear: only 11% of companies in the Forbes Global 2000 have met their net-zero targets as of 2024. By leveraging detailed transaction data, you can pinpoint high-emission sources and prioritise reductions. This helps your clients avoid becoming part of that statistic. Focus on what's most relevant to their financial performance, and create a roadmap that ties emissions reductions to their broader business and financial goals.
Step 5: Generate Compliance-Ready Benchmark Reports
Creating Branded Reports for Clients
Turn your benchmarking analysis into professional, compliance-ready reports that meet UK SRS, SECR, and ISO 14064 standards. These reports should not only reflect your firm's professionalism but also align the sustainability narrative with financial statements. This means linking governance decisions, climate risks, and strategic initiatives to production costs, investments in eco-friendly technology, and asset expenditures.
With neoeco, this process becomes much simpler. The platform generates ready-to-use templates that automatically pull and map financial data to relevant emissions categories. It also allows you to create branded reports featuring your firm's logo and colours, ensuring a polished and consistent presentation. For firms working with SMEs or voluntary reporters under the VSME standard, this streamlined approach covers everything, from data collection to the final report.
Use the Management Discussion and Analysis (MD&A) section to provide a clear connection between sustainability efforts and financial outcomes. For instance, if a client is investing in water efficiency, explain how this affects operational forecasts and financial estimates. Alongside these branded reports, ensure all supporting documentation is thorough and well-organised.
Maintaining Audit-Ready Documentation
Once the report is complete, it’s vital to maintain an accessible and detailed audit trail. This ensures that all claims, calculations, and assumptions are backed by solid evidence. Such documentation is crucial for independent verification under standards like ISO 14064-3 or newer frameworks such as ISSA 5000. Your audit trail should include sources of estimation risk, key judgements, and the transactions recorded in your client’s books.
neoeco offers a built-in Policy & Evidence Hub to keep everything in one place. This tool allows you to store supporting documents, track completed tasks, and flag pending items. A live checklist provides auditors with a clear view of what’s done and what still needs attention, ensuring every data point can be traced back to a reliable source.
Stakeholders now expect more frequent updates instead of just annual reports. By maintaining continuous documentation throughout the year, you avoid last-minute rushes and keep your clients consistently audit-ready. This proactive approach also encourages collaboration between departments, with CFOs playing a key role in linking sustainability performance to capital allocation and operational planning. With well-maintained records, your clients can confidently present their benchmarking results to regulators, investors, or assurance providers, knowing every figure is fully verifiable.
Conclusion
Key Takeaways for Accounting Firms
Using financial data to benchmark sustainability offers precise, audit-ready insights. By analysing transactions, linking them to emissions categories, calculating critical metrics, and comparing results with industry standards, accountants can help businesses adopt sustainable practices. The transition from manual, spreadsheet-heavy reporting to automated financial solutions allows firms to provide clients with ongoing visibility into their environmental performance. For instance, PepsiCo discovered that 78% of its total emissions stemmed from its value chain.
As the ICAEW emphasises:
"Accountants must take the lead on joining the dots between sustainability and finance information, performance and disclosures to ensure organisations are able to make the transformative changes needed".
This approach strengthens the connection between financial data and sustainability efforts. By integrating sustainability reporting directly within the financial ledger, tools like neoeco remove the need for manual data conversions, ensuring every metric is both accurate and traceable.
Growing Your Firm with Sustainability Services
Sustainability benchmarking also opens growth opportunities for accounting firms. CFOs and finance professionals, equipped with a comprehensive view of operations and strategies, are well-positioned to lead these efforts. As noted by CPA Australia:
"CFOs can help to ensure an organisation's commitment to ESG is translated into meaningful outcomes... by influencing resource allocation, such as investments in eco-friendly tech".
Automated sustainability software can reduce costs by as much as 80% compared to traditional, manual carbon footprint consulting. This enables firms to offer white-labelled solutions, creating new streams of recurring revenue while improving client retention. By adopting integrated, automated tools, firms can confidently navigate the evolving standards in the UK and Australia. Sustainability benchmarking isn’t a distant goal - it’s happening now. Firms that embrace these changes today will position themselves as leaders in the industry.
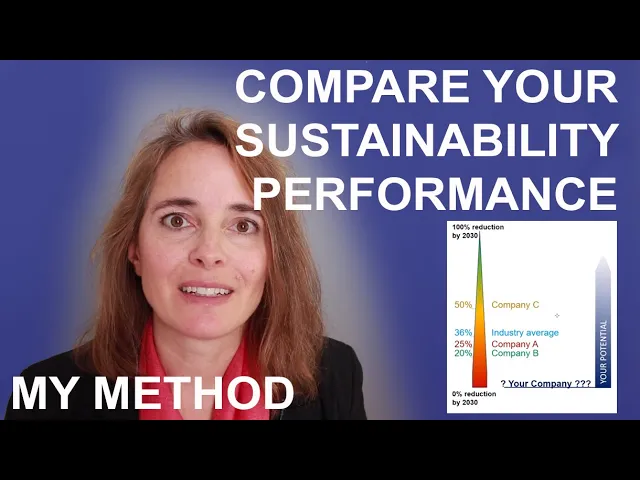
Are You More Sustainable Than Your Competitors? Sustainability Benchmarking.
FAQs
How can financial data help improve sustainability benchmarking accuracy?
Financial data plays a key role in making sustainability benchmarking more precise by offering detailed, transaction-level insights that are consistent, reliable, and ready for auditing. By directly linking financial transactions to recognised emissions categories outlined in frameworks like the GHGP, ISO 14064, and SECR, organisations can achieve sustainability metrics that are both accurate and easy to compare.
This method removes the hassle of manual data conversions or juggling spreadsheets, making the process smoother and less prone to mistakes. Using financial data not only simplifies compliance but also helps organisations create professional, trustworthy sustainability reports, positioning them to adapt more effectively to the ever-changing regulatory environment.
What are the advantages of using automated tools like neoeco for tracking emissions?
Automated tools like neoeco simplify the process of turning financial ledgers into live emissions records, eliminating the hassle of manual spreadsheets and tedious data entry. By aligning transactions with recognised standards such as GHGP, ISO 14064, and UK-specific frameworks like SECR, SRS, and ASRS 2, neoeco ensures precise, audit-ready carbon data that meets ISSB, CSRD, and other reporting requirements.
This level of automation doesn’t just cut down on errors - it also accelerates the creation of integrated finance and ESG disclosures. With less time spent on data collection, accountants can shift their efforts towards analysis and strategic planning, allowing sustainability benchmarks to be established more quickly and accurately. Ultimately, this offers a smooth and professional way to track emissions, equipping firms to deliver clear, regulator-compliant insights to their clients.
How can frameworks like SECR and ISO 14064 support sustainability benchmarking?
Frameworks like SECR (Streamlined Energy and Carbon Reporting) and ISO 14064 offer clear guidelines for measuring and reporting carbon emissions, as well as other environmental impacts. These standards are designed to promote consistency, transparency, and comparability when evaluating sustainability efforts.
When businesses align their financial data with these established frameworks, they can better understand their environmental footprint, benchmark against industry standards, and pinpoint areas for improvement. Tools such as neoeco make this process easier by directly integrating with financial ledgers. They automatically map transactions to emissions categories defined by frameworks like SECR and ISO 14064, delivering precise, audit-ready reports without the need for manual input.