IT Hardware Emissions: Scope 1, 2, or 3?
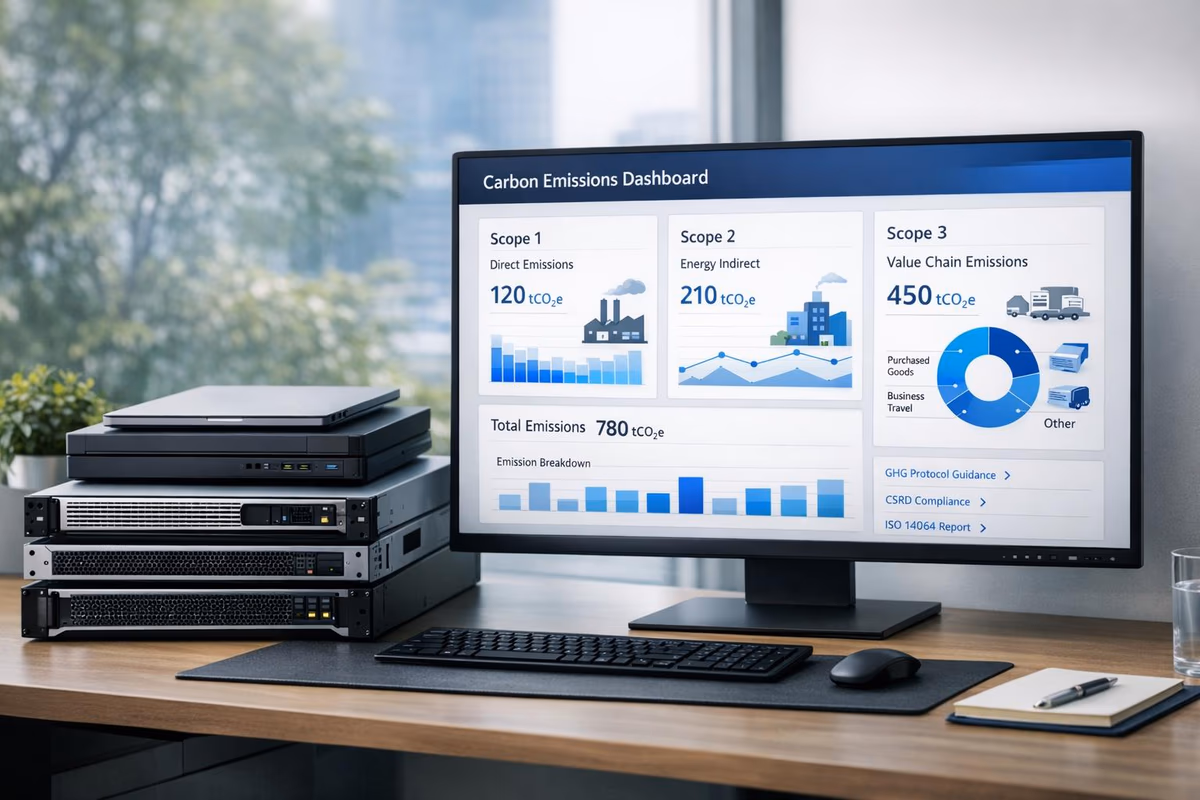
When reporting carbon emissions from IT hardware, the challenge lies in correctly categorising them into Scope 1, 2, or 3 as defined by the GHG Protocol. Misclassification can lead to regulatory non-compliance (e.g., SECR, CSRD) and accusations of greenwashing. Here's a quick breakdown:
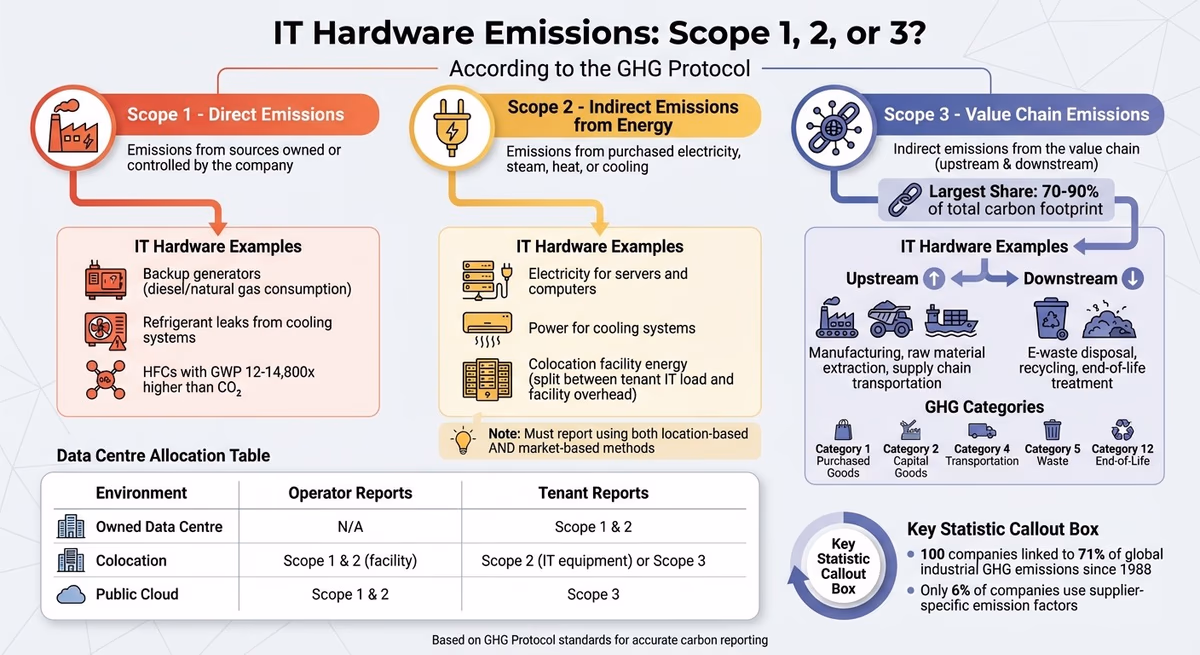
- Scope 1 (Direct Emissions): Emissions from backup generators (fossil fuel consumption) and refrigerant leaks from cooling systems in owned data centres.
- Scope 2 (Indirect Emissions): Emissions from purchased electricity used to power IT hardware, including servers and cooling systems. Colocation facilities may complicate this, as emissions can be split between tenants and providers.
- Scope 3 (Value Chain Emissions): The largest share, covering manufacturing, supply chain activities, and disposal of IT hardware. This includes emissions from production processes, transportation, and e-waste management.
Correctly categorising emissions ensures accurate reporting, builds stakeholder trust, and highlights areas for reduction. Automated tools like neoeco simplify this process by mapping emissions directly to the correct category, saving time and improving accuracy.
IT Hardware Emissions Classification Guide: Scope 1, 2, and 3 Breakdown
How to Report Carbon Footprint using IT Visibility
Scope 1 Emissions: Direct Emissions from IT Hardware
When it comes to tackling emissions, Scope 1 focuses on the direct greenhouse gas outputs from sources you own or control. In the world of IT hardware, this doesn’t mean the devices themselves but rather the infrastructure supporting them.
As the GHG Protocol compliance standards put it:
"Direct emissions are emissions from sources that are owned or controlled by the reporting company." - GHG Protocol
For IT-related operations, Scope 1 emissions generally fall into two main areas: backup generators and cooling systems.
Data Centres and Backup Generators
Backup generators, often used in on-premises data centres, are a major contributor to Scope 1 emissions. These generators run on fossil fuels like diesel or natural gas to provide emergency power during outages. Every litre of diesel burned directly releases CO₂ into the atmosphere.
To quantify these emissions, you can track fuel consumption using delivery logs or meter readings and then apply recognised emission factors, such as those provided by DEFRA. Keeping a centralised record of fuel usage across multiple data centres is also a good way to avoid missing any data when reporting.
Refrigerant Leaks from Cooling Systems
Cooling systems in data centres are another significant source of Scope 1 emissions, but in this case, it’s about fugitive emissions. These occur when refrigerant gases, essential for temperature regulation, escape due to leaks. Maintaining stable temperatures is critical to prevent hardware from overheating, but accidental leaks can have a substantial environmental impact.
Refrigerants like hydrofluorocarbons (HFCs) are commonly used in cooling systems and can have a Global Warming Potential (GWP) that’s anywhere from 12 to 14,800 times higher than CO₂. To manage these emissions, it’s important to track refrigerant usage, monitor for leaks, and carry out regular equipment inspections. Proactive maintenance can go a long way in reducing these harmful emissions.
Scope 2 Emissions: Indirect Emissions from Purchased Energy
Scope 2 emissions refer to indirect greenhouse gas (GHG) emissions generated from purchased electricity, steam, heat, or cooling. Unlike Scope 1 emissions, which stem from direct activities like burning fuel or releasing refrigerants, Scope 2 focuses on the energy used to power equipment such as IT hardware.
Under the GHG Protocol, organisations must report Scope 2 emissions using two methods: the location-based method, which calculates emissions using the average intensity of the local electricity grid, and the market-based method, which accounts for emissions based on specific energy contracts like Power Purchase Agreements (PPAs) or Renewable Energy Certificates (RECs). This dual approach ensures companies can reflect both the emissions tied to the grid and their renewable energy procurement efforts. Colocation facilities, however, add an extra layer of complexity to this reporting process.
Powering IT Infrastructure
A key example of Scope 2 emissions is the electricity consumed to run servers, computers, and cooling systems. These emissions are typically calculated using activity-based carbon accounting methods like utility bills or meter readings. This level of detail is especially important for compliance frameworks like ISSB reporting, which require precise definitions of emission boundaries.
Colocation Facilities and Energy Use
Colocation facilities, where multiple organisations share data centre space, present a more nuanced reporting challenge. Electricity usage in these environments is generally split into two categories: IT load (power used by your servers and equipment) and overhead electricity (energy for cooling, lighting, and other facility operations).
If you maintain operational control over your servers in a colocation facility, the electricity powering those servers should be reported as your Scope 2 emissions. On the other hand, overhead energy - used for cooling and lighting - is usually reported as Scope 2 emissions by the facility operator. However, the exact allocation of emissions often depends on the terms of your contract and the division of control.
To ensure accurate reporting and avoid double-counting, it’s essential to coordinate with your data centre provider to clearly define these boundaries. By doing so, you can determine which emissions fall under your responsibility and which are accounted for by the vendor.
Scope 3 Emissions: Indirect Value Chain Emissions from IT Hardware
Scope 3 emissions refer to indirect greenhouse gas (GHG) emissions generated across a company’s value chain - both upstream and downstream - from sources the company neither owns nor directly controls. Unlike Scope 1 (direct emissions from owned equipment) and Scope 2 (emissions from purchased electricity), Scope 3 focuses on the broader environmental footprint of IT hardware throughout its lifecycle.
These emissions often make up the largest share of a company’s carbon footprint, making accurate tracking essential. With reporting frameworks like ISSB and CSRD pushing for detailed value chain disclosures, understanding how to categorise and quantify Scope 3 emissions is key to managing them effectively. Let’s take a closer look at how manufacturing, supply chain activities, and end-of-life processes contribute to these emissions.
Manufacturing and Supply Chain
Upstream Scope 3 emissions for IT hardware fall under the GHG Protocol’s Categories 1 (Purchased Goods and Services) and 2 (Capital Goods). These categories include everything from raw material extraction to component production and assembly - essentially, all activities before the hardware reaches the organisation. Category 4 (Upstream Transportation and Distribution) covers logistics emissions as products move through the supply chain to the end user.
For instance, when a company buys laptops or servers, the emissions linked to mining rare earth metals, manufacturing circuit boards, assembling devices, and shipping them from factories in Asia to the UK are all considered Scope 3 emissions.
However, accurately measuring these emissions can be tricky. Only 6% of companies currently use supplier-specific emission factors. Accessing primary data from manufacturers significantly improves precision, but when this isn’t available, organisations often rely on activity-based vs spend-based emission methods. These methods use financial data and generic emission factors, which can lead to broader, less precise estimates.
End-of-Life Disposal and E-Waste
The environmental impact doesn’t stop at production - it extends to what happens when IT hardware is decommissioned. Downstream Scope 3 emissions focus on disposal and are captured under Category 12 (End-of-Life Treatment of Sold Products). This includes emissions from transporting old equipment to recycling facilities, the energy used in dismantling and processing, and emissions from landfilling materials that can’t be recovered.
Category 5 (Waste Generated in Operations) applies to emissions from disposing of an organisation’s own decommissioned equipment, while Category 12 is relevant for manufacturers tracking the disposal of products sold to customers.
"If a company produces an intermediate product (e.g., a motor), which becomes part of a final product (e.g., an automobile), the company accounts for downstream emissions associated with the intermediate product (the motor), not the final product (the automobile)." - GHG Protocol
Accurate reporting for end-of-life emissions requires tracking how waste is managed - whether equipment is recycled, sent to landfill, or processed in waste-to-energy facilities. Applying the correct emission factors for each disposal method ensures carbon reporting reflects the true environmental impact of IT hardware decisions.
Operational vs Embodied Emissions: A Clear Breakdown
When reporting IT hardware emissions, it's essential to differentiate between operational and embodied carbon. This distinction refines earlier classifications into direct, purchased, and value chain emissions.
Operational emissions are the greenhouse gases released during the use of IT infrastructure. These primarily come from the energy used to power servers, storage systems, networking devices, and cooling equipment. Typically, these emissions fall under Scope 2 (electricity purchased for owned assets) or Scope 3 (energy consumed by cloud or SaaS providers).
Embodied emissions, on the other hand, are tied to the manufacturing, transport, and disposal of hardware. These are categorised under Scope 3 (such as Category 1: Purchased Goods and Services or Category 2: Capital Goods). Interestingly, embodied emissions often make up the largest share of the total carbon footprint.
"Operational emissions encompass the greenhouse gases emitted from an organisation's own technology infrastructure and operations." – Technology Carbon Standard
This distinction is important because each type of emission requires different approaches for measurement and reduction. Operational emissions rely on primary data sources such as utility bills or meter readings, while embodied emissions are typically derived from secondary data like lifecycle assessments or spend-based estimates. By understanding where your IT hardware fits within Scope 3 categories, you can focus on areas with the greatest impact and collaborate effectively with suppliers. This clarity also helps when comparing emissions across various IT environments.
Comparison Examples Across IT Environments
The balance between operational and embodied emissions varies depending on how IT infrastructure is deployed. Here’s a breakdown of common setups:
| IT Environment | Energy Use (Operational) | Hardware Lifecycle (Embodied) |
|---|---|---|
| Owned Data Centre | Scope 1 & 2: Direct electricity use for servers and cooling; fuel for backup generators. | Scope 3: Emissions from manufacturing and transport of servers and racks. |
| Colocation Facility | Scope 3 (Indirect): Energy consumed by the provider to power and cool the tenant's space. | Scope 3: Emissions from hardware installed by the tenant. |
| Public Cloud / SaaS | Scope 3 (Cloud Services): Indirect emissions from the provider's data centre operations. | Scope 3 (Upstream): Embodied carbon of the provider's hardware fleet, attributed to the user. |
When working with managed service providers or cloud platforms, it's wise to choose those that publish thorough sustainability reports and adhere to GHG Protocol standards. This ensures accurate tracking of indirect operational emissions. Such transparency not only supports precise reporting but also helps address energy use effectively across different data centre configurations.
Categorising Emissions in Data Centre Contexts
When it comes to emissions reporting in data centres, everything revolves around who has control over the infrastructure. The GHG Protocol uses the concept of Operational Control to determine how emissions are assigned. This approach, widely used in the industry, attributes 100% of emissions to the organisation that sets and enforces operating policies.
"A company has operational control over an operation if the former or one of its subsidiaries has the full authority to introduce and implement its operating policies at the operation." – GHG Protocol
For data centres that a company owns, the operator is responsible for reporting emissions from backup generator fuel and refrigerant leaks under Scope 1, while electricity purchased from the grid falls under Scope 2. In colocation setups, the situation changes. If tenants don’t manage the facility’s cooling and power systems, those emissions stay under the provider’s Scope 1 and 2, but they count as Scope 3 for the tenant. However, when tenants control their leased spaces, they report the electricity used by their servers as Scope 2.
Things shift further with public cloud services. Since customers don’t have operational control over the infrastructure, all emissions tied to the cloud provider’s systems are classified as Scope 3 for the customer.
Allocation Table for Scope Responsibilities
| Environment Type | Emission Source | Operator/Provider Scope | Tenant Scope |
|---|---|---|---|
| Owned Data Centre | Electricity for IT & cooling | N/A | Scope 2 |
| Backup generators | N/A | Scope 1 | |
| Refrigerant leaks | N/A | Scope 1 | |
| Colocation | Facility cooling & power | Scope 1 & 2 | Scope 3 |
| Tenant IT equipment energy | Scope 3 | Scope 2 (if controlled) or Scope 3 | |
| Public Cloud | All infrastructure & IT | Scope 1 & 2 | Scope 3 |
This structured allocation ensures transparency and precision in carbon reporting. It also lays the groundwork for using advanced technology to track emissions more accurately.
To avoid double-counting, clear contractual agreements are essential. Emissions that the operator reports as Scope 1 or 2 automatically become Scope 3 for the tenant. In colocation environments, sub-metering can further refine reporting by distinguishing whether energy use should fall under Scope 2 or Scope 3.
Using Technology for Accurate Carbon Reporting
Manually tracking IT hardware emissions using spreadsheets can be a real headache. It’s time-consuming, prone to errors, and requires constant updates to stay aligned with GHGP standards. Considering that Scope 3 emissions often account for a massive 70–90% of a company’s carbon footprint, there’s little room for mistakes.
This is where carbon accounting platforms come into play. By integrating directly with financial ledgers, these tools remove much of the hassle. Instead of manually extracting and reformatting data, the software automatically maps transactions to the correct emissions categories. This not only reduces human error but also ensures transactions are classified accurately into their respective emissions scopes.
| Feature | Manual Spreadsheets | Specialised Platforms |
|---|---|---|
| Data Source | Manual entry from various sources | Direct integration with financial ledgers (e.g., Xero, Sage, QuickBooks) |
| Automation Level | Low (manual entry and calculation) | High (automated transaction matching to carbon categories) |
| Accuracy | Prone to human error and inconsistencies | High accuracy with automated matching and robust methodologies |
| Audit Readiness | Extensive manual setup | Automated audit controls with secure evidence storage |
| Compliance Support | Manual updates required | Automatic updates for UK (SECR, SRS) and Australian (ASRS) frameworks |
This comparison makes it clear: automated systems not only save time but also ensure accuracy and compliance with minimal effort.
neoeco for Sustainability Reporting
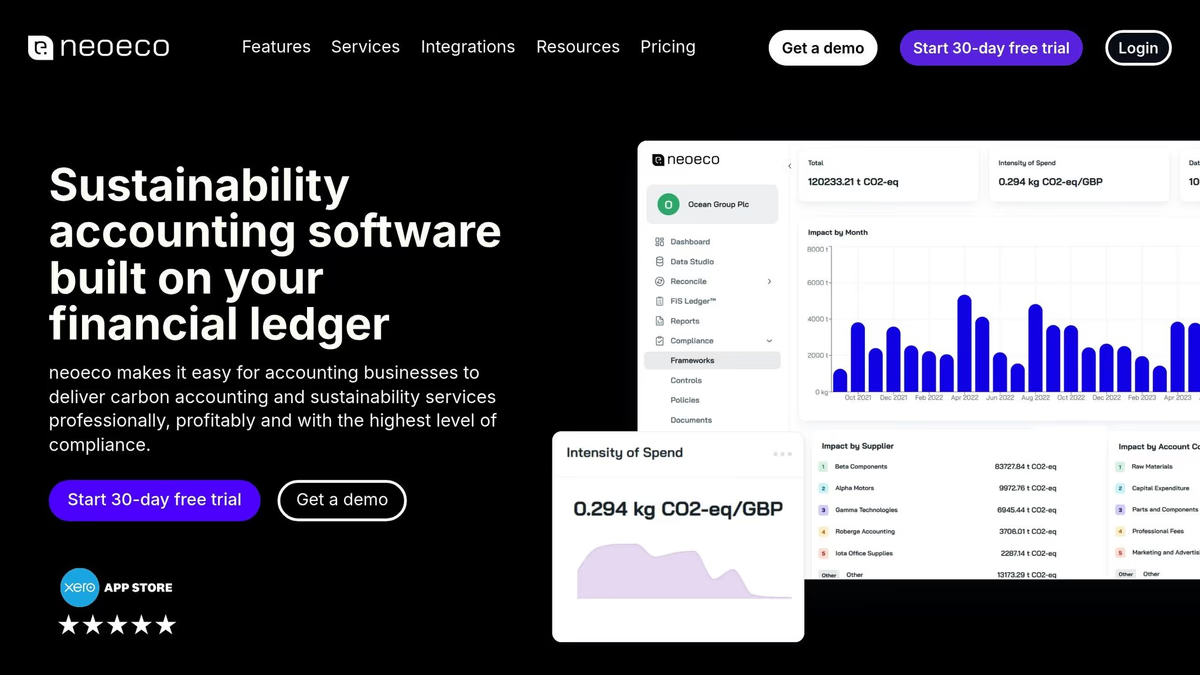
Taking automation a step further, neoeco simplifies sustainability reporting by directly connecting to clients’ financial systems. It classifies transactions into the appropriate emissions scopes with ease. For instance, when a client purchases servers, the platform automatically categorises the embodied emissions under Scope 3. Energy bills for data centres? Those are mapped to Scope 2. Fuel for backup generators? That’s Scope 1. The entire process is handled seamlessly.
neoeco also functions as a sustainability report generator to produce compliance-ready reports for frameworks like SECR, UK SRS, and ASRS 2, eliminating the need to rebuild data structures for each reporting requirement. Its audit controls track what’s done, what’s missing, and what needs attention, while securely storing evidence for assurance under standards like ISO 14064 or ISSA 5000. For companies managing Scope 3 emissions across multiple clients, this level of automation transforms a task that used to take weeks into a continuous background process.
Conclusion
Properly categorising IT hardware emissions using Life Cycle Assessment is a cornerstone of reliable carbon reporting. With Scope 3 emissions often making up 70–90% of an organisation's total carbon footprint, getting this classification right is not just important - it’s essential.
Transitioning from manual tracking to automated systems is a game-changer. Manual methods are prone to errors and inefficiencies, while automation tools that sync with financial ledgers streamline the entire process. These tools not only improve accuracy but also ensure your reports are ready for audits from the outset.
Take platforms like neoeco, for example. They’ve turned what was once a laborious, weeks-long task into a seamless, continuous process. By integrating directly with clients' financial systems, neoeco automatically categorises server purchases as Scope 3, energy bills as Scope 2, and generator fuel as Scope 1. The result? Compliance-ready reports tailored for SECR, UK SRS, and ASRS 2 regulations - all without the manual hassle.
Zooming out to the bigger picture, the tech industry has a unique responsibility to lead in addressing climate challenges. It’s worth noting that just 100 companies have been linked to 71% of global industrial greenhouse gas emissions since 1988. By ensuring accurate emissions categorisation and embracing automation, the sector can set a standard for transparent, audit-ready reporting that meets the growing demands of stakeholders.
FAQs
How can businesses accurately classify IT hardware emissions under Scope 1, 2, or 3?
To get a clear picture of IT hardware emissions, it’s essential to understand the three scopes outlined by the Greenhouse Gas Protocol. Here’s how they break down: Scope 1 covers direct emissions from assets a company owns or controls, such as on-site generators. Scope 2 focuses on indirect emissions from purchased energy, like electricity or heat. Scope 3 accounts for all other indirect emissions, including the manufacturing, transport, and disposal of purchased IT hardware.
For IT equipment, emissions linked to manufacturing and supply chain activities are classified under Scope 3 (Category 1: Purchased Goods and Services). Meanwhile, the electricity used to power devices like servers or workstations falls under Scope 2. Accurate classification relies heavily on primary data, such as supplier-specific details about materials and energy usage, as this information is more precise and audit-ready. When primary data isn’t available, secondary data - like industry averages - can be used, but it’s important to update these figures whenever better data becomes accessible.
Automating data collection can significantly reduce errors and improve consistency. Tools like neoeco simplify this process by linking financial transactions directly to recognised emissions categories, delivering reliable and audit-ready carbon data. To ensure ongoing accuracy and compliance, it’s crucial to maintain clear governance, regularly updated asset inventories, and transparent documentation.
What are the challenges of reporting emissions from colocation data centres?
Colocation data centres are managed by third-party providers, which means tenants have limited say over how the facility housing their IT hardware operates. This setup presents two major hurdles when it comes to emissions reporting. First, the provider typically records emissions from energy use, cooling systems, and other services. However, this data is often based on incomplete or generic industry averages rather than detailed, site-specific measurements. Second, since tenants do not own the facility, these emissions are classified under Scope 3 of the GHG Protocol. Allocating these emissions based on lease agreements and operational control can be a complex and time-intensive task.
Adding to the challenge, there are no standardised tools for measuring Scope 3 emissions, and obtaining accurate, primary data is often difficult. As a result, many organisations rely on secondary data, which tends to be less precise and harder to verify during audits. Automated tools like neoeco offer a way to tackle these issues by combining financial data with emissions factors, applying consistent methodologies, and producing accurate, audit-ready reports with ease.
Why are Scope 3 emissions important when assessing the environmental impact of IT hardware?
Scope 3 emissions are a major focus in IT hardware because they make up the bulk of a device's carbon footprint. These emissions cover every stage of the hardware's lifecycle: from extracting raw materials and manufacturing to transportation, usage, and disposal at the end of its life.
While Scope 1 and Scope 2 emissions are more straightforward and easier to measure, Scope 3 emissions present a greater challenge due to their complexity. Despite this, they are the most significant contributor to overall emissions in IT and data centres. Accurately assessing these emissions is crucial for meaningful carbon reporting and reduction strategies.