Checklist: Visualising Materiality Data for Compliance

Creating visuals for materiality data is essential for meeting compliance standards like SECR, UK SRS, and ISSB. Here's a quick breakdown of how to prepare, visualise, and validate your materiality data effectively:
- Preparation: Organise data from financial records, emissions, and surveys. Ensure consistency and traceability to regulatory frameworks like GHGP protocol compliance and ISO 14064.
- Visualisation: Use tools like matrices, heatmaps, or charts to present financial and impact materiality clearly. Link visuals to business models and compliance requirements.
- Automation: Platforms like neoeco streamline data integration, reducing errors and keeping dashboards updated in real time.
- Validation: Conduct cross-functional reviews, document evidence, and ensure audit readiness with clear methodologies and thresholds.
- Regular Updates: Materiality evolves - schedule annual reviews and maintain version control for ongoing compliance.
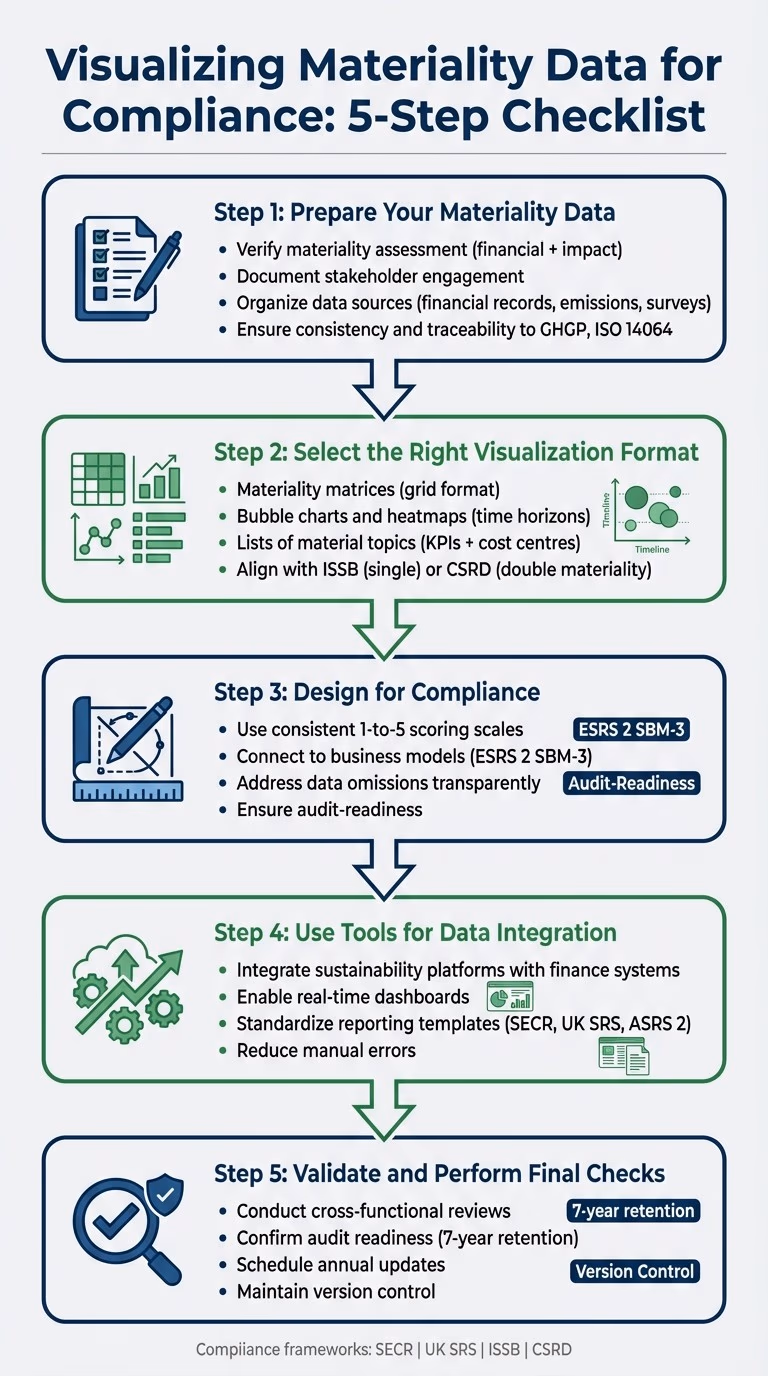
5-Step Process for Visualizing Materiality Data for Compliance
Step 1: Prepare Your Materiality Data
### Conduct a Materiality Assessment
Make sure your materiality assessment addresses both financial and impact materiality. Regulatory frameworks require you to clearly demonstrate how each material topic was identified, assessed, and prioritised. This includes defining quantifiable thresholds or providing a solid qualitative basis for each topic. For instance, you might document the percentage of Scope 3 emissions and explain its relevance to stakeholders.
Document Stakeholder Engagement
Keep detailed records of your stakeholder engagement process. Include information about who participated, when consultations took place, how feedback was collected, and how it informed your assessment. Tailor your documentation to align with the most stringent framework requirements, such as ISSB, CSRD, or UK SRS, ensuring you have a robust audit trail.
Once this is complete, consolidate this information by standardising your data sources.
Organise Your Data Sources
Compile and standardise data from various sources like financial records, emissions calculations, survey responses, and disclosures. Inconsistent formats can create challenges, so maintaining uniformity is key to ensuring accuracy and audit readiness.
Tools like neoeco can simplify this process by automating data consolidation. This tool links financial transactions to recognised emissions categories under frameworks such as GHGP, ISO 14064, SECR, and UK SRS. By automating these connections, it eliminates manual data handling and ensures that your materiality data is traceable back to audited financial records.
Thorough preparation of your data lays a solid foundation for the visualisation methods in the next steps and supports compliance throughout the reporting process.
Visualising Double Materiality Results - at Code Gaia
Step 2: Select the Right Visualisation Format
Once your materiality data is organised, the next step is choosing a visualisation format that clearly distinguishes between single materiality (ISSB) and double materiality (CSRD). The format should align with your chosen framework's standards, meet stakeholder needs, and support audit readiness. It must also connect seamlessly to the traceability established in Step 1. Below are some effective options for presenting your data.
Materiality Matrices
Materiality matrices use a grid to plot financial materiality on one axis and impact materiality on the other, with each material topic represented as a point. To maintain consistency and comparability, apply the same scoring scale (e.g., 1-to-5) across all topics, whether it’s Scope 3 emissions or board diversity. The upper-right quadrant typically highlights the highest-priority topics - those scoring highly on both axes - which often require detailed metrics, specific targets, and external assurance. Each point should link back to its source documentation, something automated platforms handle more reliably than manual spreadsheets.
Bubble Charts and Heatmaps
Bubble charts and heatmaps are ideal for showing materiality over different time horizons, a requirement for scenario analysis under many frameworks. Categorise topics into short-, medium-, and long-term risks to ensure that longer-term challenges, like biodiversity loss or water scarcity, are not overlooked. Heatmaps use colour coding to indicate the severity or urgency of issues, while bubble charts can show relative importance. Be sure to reference each element's regulatory trigger. For companies managing Scope 3 emissions across complex supply chains, these formats help stakeholders quickly identify high-priority areas.
Lists of Material Topics
A straightforward list can link material topics directly to key performance indicators and financial cost centres, making it easy to demonstrate business integration and accountability. This approach works particularly well for voluntary reporters or SMEs that need a clear, simple way to present their data without overwhelming visuals.
Step 3: Design for Compliance
When creating visuals, ensure they align with ESRS 1 and ESRS 2 standards. This means prioritising audit-readiness, transparency, and a clear connection to double materiality principles. At this stage, your prepared data and chosen format come together to produce compliant and meaningful visual representations.
Use Consistent Scales and Legends
Stick to a uniform 1-to-5 scoring scale for all metrics, and make sure your legend explains what each score means. For example, clarify whether a "5" indicates a material impact exceeding 5% of net income or reflects the intensity of stakeholder feedback. Clearly document ESG materiality evidence and define thresholds to support audit processes. If your organisation handles Scope 3 emissions, maintaining consistent threshold definitions is especially critical for clarity and compliance.
Connect to Business Models
Your visuals should do more than present data - they should tie directly to your business operations. ESRS 2 SBM-3 requires companies to show how material impacts, risks, and opportunities are linked to their business model and strategy. Use annotations to highlight how material topics affect revenue streams, cost centres, or strategic goals. For instance, illustrate how water scarcity impacts specific business units. This approach ensures your materiality assessment is seen as part of your broader operations. Tools designed for financially-integrated sustainability management can simplify this process by linking material topics directly to financial ledgers.
Address Any Omissions
Be upfront about any gaps in your data or analysis. Whether these omissions stem from data limitations or materiality thresholds, disclose them clearly and outline your plans to address these issues. Failing to document omissions can undermine audits and damage stakeholder confidence, so transparency here is non-negotiable.
Step 4: Use Tools for Data Integration and Automation
Once your data is prepared and your visual formats are selected, automation becomes the key to bridging finance and sustainability compliance. Relying on manual processes often leads to errors, delays, and incomplete audit trails. Automated tools, on the other hand, streamline data collection, map transactions to recognised frameworks, and keep compliance dashboards updated in real-time. This sets a solid foundation for creating accurate and compliant performance visuals.
Use Sustainability Platforms
Leverage platforms that seamlessly integrate with your financial systems. For instance, neoeco connects directly with software like Xero, Sage, or QuickBooks. It automatically maps transactions to emissions categories recognised under frameworks such as GHGP, ISO 14064, SECR, and UK SRS. This eliminates the need for manual data entry, allowing information to flow directly into compliant reports. By bypassing spreadsheets, these platforms consolidate finance and sustainability data into a unified source of truth.
Enable Real-Time Dashboards
Static reports often become irrelevant quickly. Real-time dashboards allow you to track emissions intensity, key metrics, and compliance status as data evolves. This is especially useful when supply chain data changes frequently. Dashboards also help you spot anomalies early - like unexpected cost increases or missing data - that could impact audits.
Dynamic monitoring works best when paired with consistent reporting practices.
Standardise Reporting Templates
Using standardised templates for frameworks like SECR, UK SRS, and ASRS 2 can save time and eliminate formatting inconsistencies. These templates ensure reports follow a uniform structure, apply consistent thresholds, and present data in a format familiar to auditors. Platforms like neoeco offer pre-built templates that automatically update to reflect evolving regulatory requirements, keeping your reports compliant without additional effort.
Step 5: Validate and Perform Final Checks
Once you've automated your data flows and created visuals that align with compliance standards, the next crucial step is validation. This ensures your visuals meet regulatory requirements and pass audits without issues. Skipping this step could lead to non-compliance or audit failures.
Conduct Cross-Functional Review
Bring together teams from sustainability, finance, and risk to conduct a thorough review. The goal here is to verify the accuracy of your visuals, ensure they align with the required frameworks and align ESG data with ISSB standards, and identify any compliance gaps. During this process, document all details, including team feedback and any changes made.
By maintaining an audit trail of these reviews, you demonstrate due diligence. This is especially helpful for assurance processes under frameworks like ISO 14064 or ISSA 5000.
Confirm Audit Readiness
Every visual you present must be supported by clear documentation. This includes methodologies, thresholds, and traceable inputs from stakeholders. Auditors will expect evidence of how topics were identified, how stakeholder feedback was weighted, and the reasoning behind visual placements.
| Documentation Category | Required Evidence | Retention Period |
|---|---|---|
| Stakeholder Identification | Contact databases, relationship mapping, materiality justification | 7 years |
| Engagement Planning | Methodology documents, timeline schedules, framework alignment | 7 years |
| Validation Evidence | Cross-reference checks, discrepancy resolution, approval records | 7 years |
| Change Management | Version logs, modification records, approval workflows | 7 years |
Using platforms like neoeco can streamline this process. They centralise your documentation and compliance reports, making it easier to provide the required evidence without digging through emails or spreadsheets.
Wrap up your validation process by setting up a system for regular updates to keep everything current.
Schedule Regular Updates
Materiality is not static - it evolves over time. To stay compliant with standards like SECR, UK SRS, and ISSB reporting, establish an annual review process. Update your data and visuals periodically to reflect any changes.
Set calendar reminders, assign clear responsibilities for updates, and maintain version control to track how your visuals evolve. This not only keeps your reporting accurate but also ensures you're always prepared for audits, year after year.
Conclusion
Visualising materiality data for compliance isn't just about creating attractive visuals - it's about establishing a reliable, audit-ready process that can withstand regulatory scrutiny. By following this checklist, you can ensure your materiality matrices and performance visuals meet the requirements set out by SECR, UK SRS, and new frameworks like ISSB.
The real challenge lies in moving away from outdated manual spreadsheets and scattered documentation. Tools like neoeco simplify this by automating data integration. They connect directly to financial systems like Xero, Sage, QuickBooks, MYOB, and NetSuite, mapping transactions to emissions categories under GHGP and ISO 14064. This dynamic connection ensures your materiality profiles update automatically as your financial data changes, creating a seamless link between financial and sustainability reporting.
Centralising evidence management is another critical step. By securely storing stakeholder records, validation evidence, and compliance files in one place, you make audits smoother and more efficient. This approach aligns with the principles of Financially-integrated Sustainability Management (FiSM), ensuring your sustainability metrics are as dependable as your financial data.
Materiality is not static. Regular reviews, standardised templates, and real-time dashboards help keep your visuals accurate and ready for audits at all times.
FAQs
How does visualising materiality data help organisations comply with frameworks like SECR and ISSB?
Visualising materiality data allows organisations to pinpoint and prioritise the ESG factors that hold the greatest influence over decision-making, risk management, and reputation. By concentrating on these key areas, businesses can ensure their reporting aligns with frameworks like SECR, ISSB, and regulatory requirements such as the UK SRS and EU CSRD.
This approach not only supports accurate and relevant sustainability reporting but also simplifies compliance efforts while showcasing accountability to stakeholders.
What are the advantages of using automation tools like neoeco to visualise materiality data?
Automation tools, such as neoeco, make visualising materiality data much easier by automating tasks like data collection and mapping. This eliminates the hassle of dealing with manual spreadsheets or conversions, while also ensuring alignment with recognised standards and minimising the chances of human error.
With its real-time, audit-ready dashboards, neoeco offers finance-grade insights that help businesses make informed decisions and improve communication with stakeholders. By seamlessly integrating with financial data, neoeco connects sustainability efforts with accounting processes, allowing companies to produce accurate and professional sustainability reports with ease.
Why is it essential to regularly update and review materiality data?
Regular updates and reviews of materiality data are essential for staying compliant and ensuring the precision of ESG reporting. As regulations shift, stakeholder expectations evolve, and market conditions fluctuate, keeping this data current helps your organisation stay aligned with changing standards and maintain its relevance.
These regular reviews don’t just tick the compliance box - they also improve decision-making. With an accurate and up-to-date view of your organisation's sustainability performance, you’ll be better equipped to address risks and seize opportunities effectively.